Animated images, such as GIFs, can add an extra layer of engagement and interactivity to your Power BI reports. However, their use should be strategic to enhance the report’s purpose rather than create unnecessary distractions. This guide outlines the steps for adding GIFs to Power BI reports and best practices to ensure their effective use.
If you have ever tried to add an animated image or a GIF to a Power BI report, you would probably have noticed that it won’t work. It will just display a static image of the first frame of the animation. However, there is a «hack» to implement such functionality.
Adding Animated Image
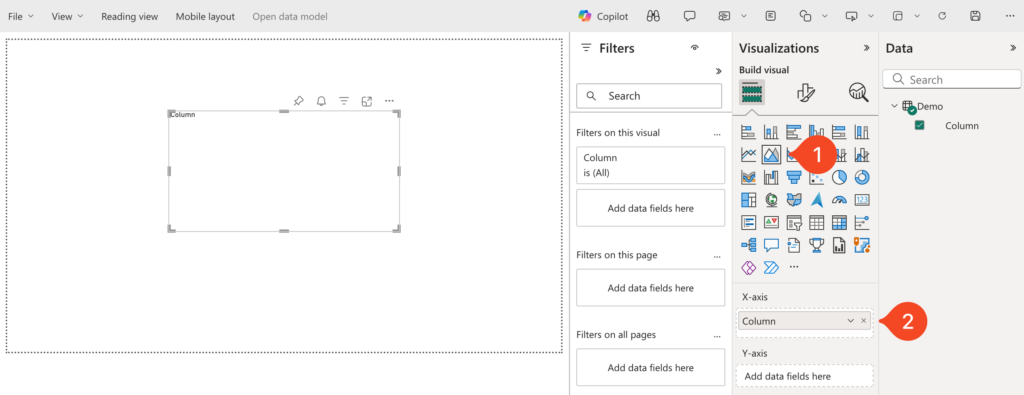
Add an area chart to your canvas. Add some dummy data to the X-axis data field. It does not matter what you add, as it will be irrelevant to the result.
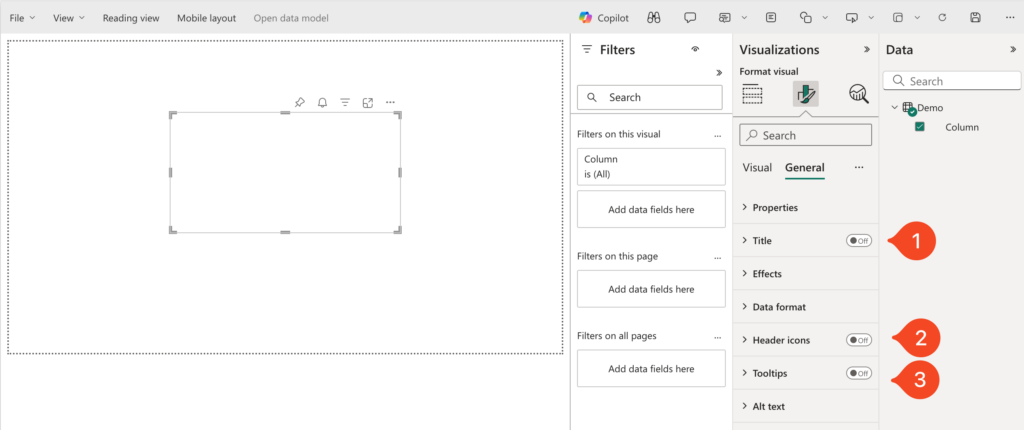
Now, let’s go to the general settings of the visualization to remove all visual elements from the canvas. Remove the title, the header icons and tooltips to make it “invisible”.
Once you have removed all visual elements, click on “Visual” and add your animated image as the “Plot area background”. This will give you the ability to use your animated image within your report.
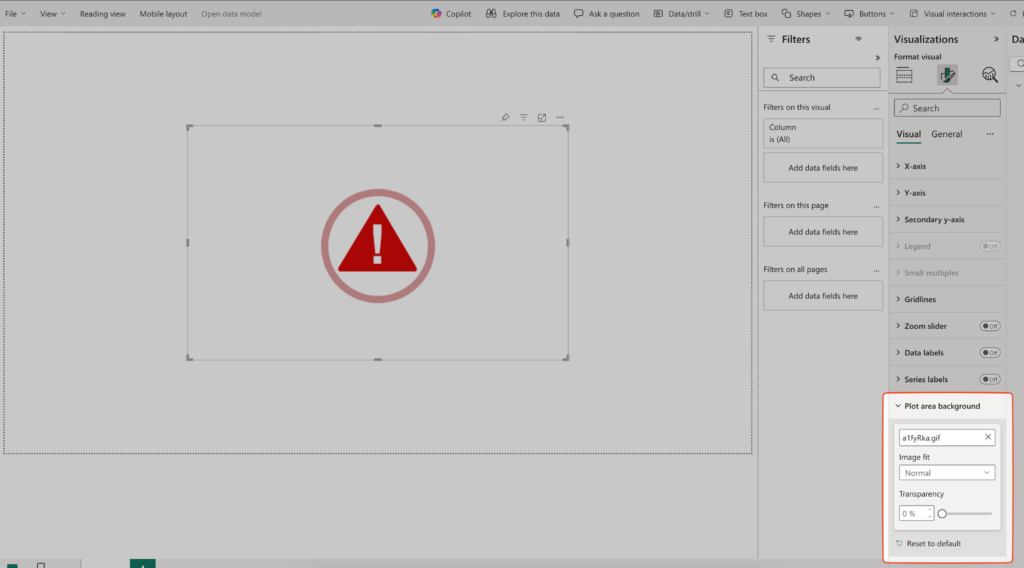
Here is an example of how you can incorporate animated GIFs, without going overboard.
A simple hack that could elevate your reports to new heights if used correctly, or completely shift the focus away from your numbers if used incorrectly.