Streamlit has quickly become a favorite tool among data professionals, and for good reason. It lets you create interactive, user-friendly (and really good looking, in my opinion) web apps straight from your Python scripts without having to learn complex frontend frameworks. It’s blazing fast and whether you’re visualizing your latest data analysis, building a quick prototype, or sharing machine learning results, Streamlit makes the process fast, fun, and accessible. With a simple and intuitive API, you can build dashboards, prototypes, interactive ML models or data visualizations in minutes, all while leveraging the full capabilities of Python libraries like Pandas, NumPy, and Matplotlib to name a few.
Streamlit can be deployed on any major cloud platform like Azure, GCP, and AWS for enterprise-grade setups. Alternatively, if you just want to experiment or build something quick, you can run it locally on your own computer or use the free Streamlit Community Cloud.
Installing Streamlit
In this article, I’ll walk you through running Streamlit locally on your own computer. Streamlit is all about Python, so a prerequisite is that you already have your Python environment up and running on your computer.
To get started, we can pip-install Streamlit directly from the terminal. Consider doing this in a virtual environment.
pip install streamlitAfter the installation is done, you can verify that it’s available by running the following command
streamlit --versionThat’s it. Pretty simple.
Understanding the Syntax
Streamlit’s simplicity is what makes it stand out. To create your first app, all you need is a Python script with a few Streamlit function calls. At its core, Streamlit is built around the concept of writing Python code as you normally would and using Streamlit’s functions to display text, data, charts, and widgets.
Here’s a quick breakdown of some common Streamlit functions:
st.write(): Displays text, data, or markdown in your app.st.text_input(): Creates a text input widget.st.slider(): Lets users select values within a range.st.dataframe(): Displays Pandas DataFrames.st.line_chart(): Plots a simple line chart.
For example, to display “Hello world!”, your script would look like this:
import streamlit as st

st.write("Hello world!")
You can then run your script with:
streamlit run demo.pyThis will start a local Streamlit server.
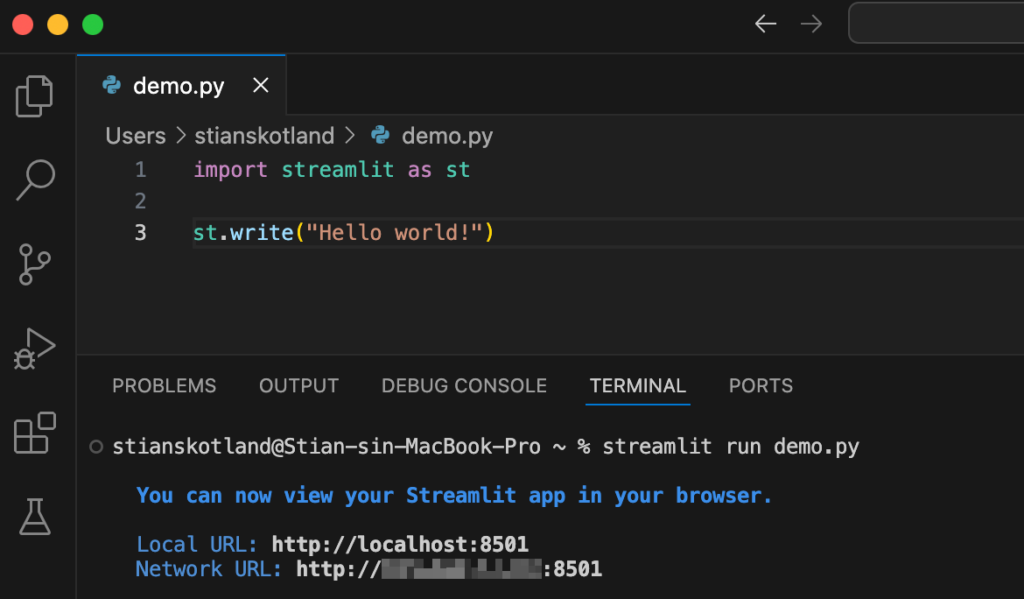
When the local Streamlit server boots up, it will automaticly navigate to your web app in your default browser (http://localhost:8501).
You can also add multiple widgets to your application. Let’s play around with some visualizations available in the Streamlit library. Here is an example including some of the different widgets to give a taste of the possibilities within Streamlit, using dummy data:
Want to see the app in action? Click here!
# Remember to pip-install pandas and numpy

import streamlit as st
import pandas as pd
import numpy as np

# Title of the app
st.title("Streamlit Widgets and Visualizations")

# Text input widget
user_name = st.text_input("What's your name?", "")

# Display a personalized greeting
st.write(f"Hello, {user_name}! Welcome to Skotland BI.")

# Slider widget
number = st.slider("Pick a number", 0, 100, 25)  # min: 0, max: 100, default: 25
st.write(f"You selected the number: {number}")

# DataFrame visualization
data = pd.DataFrame(
    np.random.randn(10, 3),
    columns=['A', 'B', 'C']
)
st.write("Here is a random DataFrame:")
st.dataframe(data)

# Line chart
st.write("Line chart visualization:")
st.line_chart(data)

# Checkbox for interactivity
if st.checkbox("Show additional details"):
    st.write("You selected to see more details!")
    st.write("Summary statistics of the DataFrame:")
    st.write(data.describe())

# Selectbox widget
chart_type = st.selectbox(
    "Select the type of chart you want to display:",
    ["Line Chart", "Bar Chart"]
)

# Conditional chart rendering
if chart_type == "Line Chart":
    st.line_chart(data)
elif chart_type == "Bar Chart":
    st.bar_chart(data)

# Final message
st.write("Thank you for reading this article at SkotlandBI.com!")
A Practical Example: Building a Mortgage Calculator
Let’s put this knowledge into practice by building a simple mortgage calculator. This app will allow users to input loan details and calculate their monthly payment while visualizing the loan repayment plan.
We have already installed Streamlit, but for this example we also need the pandas and numpy libraries.
pip install pandas
pip install numpy
Create a new file named demo.py and add the following code (simple framework and logic for mortgage calculation):
import streamlit as st
import pandas as pd
import numpy as np

# App title
st.title("Mortgage Calculator")

# Input fields for loan details
loan_amount = st.number_input("Loan Amount ($):", min_value=0.0, value=250000.0, step=1000.0)
annual_interest_rate = st.number_input("Annual Interest Rate (%):", min_value=0.0, value=3.5, step=0.1)
loan_term_years = st.number_input("Loan Term (years):", min_value=1, value=30, step=1)

# Calculate monthly payment when button is clicked
if st.button("Calculate Monthly Payment"):
    monthly_interest_rate = annual_interest_rate / 100 / 12
    number_of_payments = loan_term_years * 12

    if monthly_interest_rate > 0:
        monthly_payment = (loan_amount * monthly_interest_rate) / (1 - (1 + monthly_interest_rate) ** -number_of_payments)
    else:
        monthly_payment = loan_amount / number_of_payments

    st.write(f"### Monthly Payment: ${monthly_payment:,.2f}")

    # Generate amortization schedule
    months = np.arange(1, number_of_payments + 1)
    remaining_balance = loan_amount
    balances = []
    for month in months:
        interest_payment = remaining_balance * monthly_interest_rate
        principal_payment = monthly_payment - interest_payment
        remaining_balance -= principal_payment
        balances.append(remaining_balance if remaining_balance > 0 else 0)

    # Create a DataFrame for visualization
    df = pd.DataFrame({"Month": months, "Remaining Balance": balances})

    # Line chart for repayment plan
    st.line_chart(df.set_index("Month"))

    st.write("The chart above visualizes how your loan balance decreases over time. By observing the repayment plan, you can understand the impact of your monthly payments on reducing the principal.")
Run the script using the following command:
streamlit run demo.pyYour browser will open with a simple interface where users can input loan details, calculate their monthly mortgage payment, and visualize the repayment plan. This is very cool.
Final Thoughts
This is the type of article that could have been a 10-hour read, but I’ve tried to narrow it down to the basics to give you a taste of what it can do. The possibilites and use cases are endless. Streamlit is a game-changer for anyone looking to transform data insights into engaging, interactive applications without the overhead of mastering frontend development. Its simplicity and flexibility make it accessible to data professionals, while its power and scalability allow for robust solutions suitable for enterprise use.
What sets Streamlit apart is how quickly you can go from an idea to a functional prototype. With just a few lines of Python, you can create tools that not only showcase your data but also enable users to interact with it and explore scenarios.
As with any tool, the best way to learn is by doing. I encourage you to take the examples in this article as a starting point and experiment with building your own apps. Try integrating it with APIs, using machine learning models, or combining it with other Python libraries to push its boundaries.
You can find the official documentation for Streamlit here.